
Rhino Container
A Novvia Group Company

Blog
Top 10 Cupstock Board Suppliers for Global Buyers
For global buyers, choosing a Cupstock Board supplier is a technical decision, not simply a price comparison. The board must hold its shape, support clean printing, and resist liquid during everyday use. A cup on a café counter may look simple. Its performance depends on fiber quality, coating consistency, converting suitability, and careful handling.
This guide compares ten suppliers through buyer-relevant criteria: product range, production capability, quality controls, customization, and export experience. These details help procurement teams ask better questions before requesting samples or quotations. A specification sheet matters, but so does a real trial. Check how the board runs on your equipment, how the rim forms, and whether the finished cup stays firm under realistic conditions. Small differences show up fast.
A trusted expert quote can sharpen this introduction, but no source material was provided to verify a named Cupstock Board specialist or an exact quotation. Rather than invent one, this guide focuses on practical checks buyers can confirm directly with suppliers. That restraint matters. Supplier claims may sound similar, while documentation, sample performance, and communication can differ considerably. Even a strong supplier may not fit every market or converting line. That deserves a second look.
The following supplier overview is designed to support informed shortlisting, not replace technical evaluation. Compare evidence, test samples, and confirm specifications before making a purchasing decision.
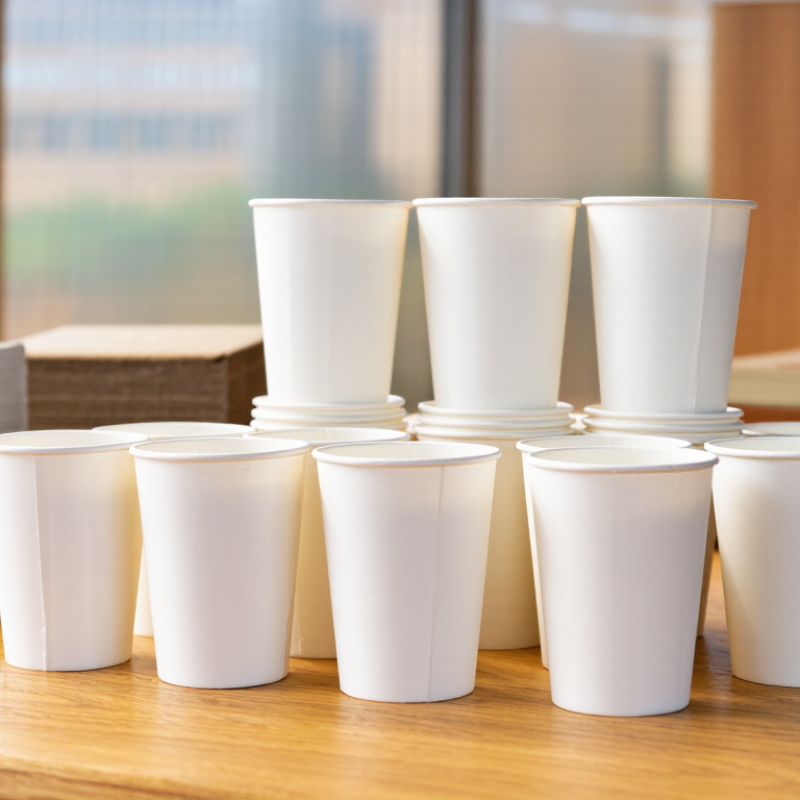
Cupstock Board Fundamentals: Typical 170–350 g/m² Grammage and PE Barriers
Cupstock board commonly falls between 170 and 350 g/m², but grammage alone does not determine cup strength. Lower-weight stock can suit small cold-drink cups; heavier board often supports larger cups and firmer rims. The hand test matters: a blank should bend cleanly, then recover without cracking. Not just weight.
PE barriers add resistance to liquid and help the side seam seal. A single-sided coating may suit many standard cup designs, while double-sided coating can be specified for demanding moisture exposure. More coating is not automatically better. It can affect forming, recycling routes, and how readily mills accept used cups.
The CEPI Key Statistics 2023 report records about 79.5 million tonnes of European paper and board production in 2023. That broad figure shows the scale of the fibre sector, not cupstock output specifically. Buyers should request coating weight, board moisture, stiffness, and seal-test results for the exact grade. ISO 536 provides the standard method for measuring paper and board grammage. Still, a tidy specification can miss real line conditions: forming speed, storage humidity, and hot-fill temperature all matter. A trial on the intended converting equipment is worth the extra time.
Top 10 Cupstock Board Suppliers for Global Buyers - Cupstock Board Fundamentals: Typical 170–350 g/m² Grammage and PE Barriers
Buyer comparison of ten commonly specified cupstock grades. Grammage refers to the baseboard; barrier-coating weight is additional. Specifications are indicative, not supplier-specific—confirm availability, tolerances, food-contact compliance, and performance with each mill.
| No. | Typical grade / construction | Baseboard grammage | Barrier option | Common application | Buyer checks |
|---|---|---|---|---|---|
| 1 | Lightweight single-wall cupstock | 170–190 g/m² | Single-side PE; typically around 12–18 g/m² coating weight | Small cold-drink cups and portion cups | Confirm converting strength, seam sealing, and liquid-hold performance. |
| 2 | Standard single-wall cupstock | 190–210 g/m² | Single-side PE; commonly specified around 15–20 g/m² | Everyday cold-drink cups | Check stiffness after forming and compatibility with the cup line. |
| 3 | Medium-weight hot-cup board | 210–230 g/m² | Single-side PE; coating weight set to application requirements | Hot beverages in single-wall cups | Test hot-liquid resistance, side-seam integrity, and rim curling. |
| 4 | Higher-stiffness hot-cup board | 230–250 g/m² | Single-side PE, often around 15–20 g/m² | Larger or sturdier single-wall hot cups | Review stiffness, curl, print surface, and forming consistency. |
| 5 | Heavy-duty cupstock | 250–280 g/m² | Single-side PE or other application-specific barrier | Large cups and applications requiring greater stiffness | Confirm die-cutting and forming settings for the heavier board. |
| 6 | Single-side PE, print-side coated cupstock | 190–260 g/m² | PE on the liquid-contact side; reverse side prepared for printing | Printed beverage cups | Specify print process, surface requirements, and coating orientation. |
| 7 | Double-side PE cupstock | 200–300 g/m² | PE on both sides; coat weights specified per side | Cups needing moisture resistance on both surfaces | Check total finished grammage, sealability, and recycling requirements. |
| 8 | High-barrier cupstock for chilled use | 200–300 g/m² | PE or a specified alternative moisture barrier | Cold drinks, condensation-prone service, and longer hold times | Request test data for the intended liquid, temperature, and use duration. |
| 9 | Dispersion-coated cupstock | 190–300 g/m² | Aqueous barrier coating; performance depends on the specific formulation | Selected cups designed for plastic-reduction or recycling programs | Verify food-contact status, repulpability claims, and local recycling acceptance. |
| 10 | Heavy cupstock for specialty formats | 300–350 g/m² | Single- or double-side barrier, selected for the end use | Large-format cups and demanding converting applications | Check machine limits, board caliper, stiffness, and finished-cup weight. |
Specification note: Cupstock grades, PE coat weights, and barrier performance vary by producer and market. Request a current technical datasheet and food-contact documentation for the intended use.